Draw a representation of gases under given conditions.
- Sketch particle spacing for a gas at high vs. low pressure.
-
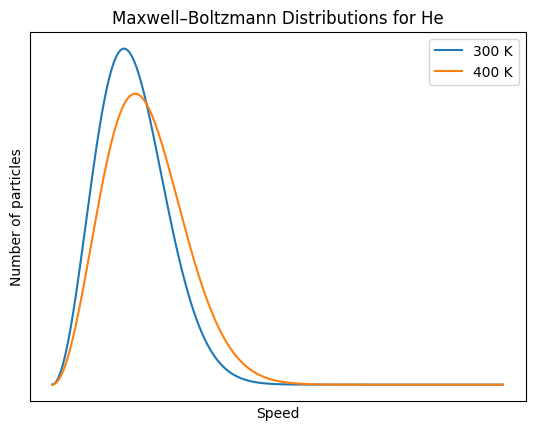
The diagram below shows a particle diagram of a sample of
O2(g) at 300K. Sketch the sample after it has been increase
to 400K
 The sketch shows the same number of particles and arrows representing velocities that are on average longer.